Generating a thread dump
A thread dump captures what every thread in the application is doing at one moment. Support may ask for one when the application is slow or appears hung.
Linux, *nix, and macOS
-
Get the process id (pid) of the Cascade CMS process:
Bashps aux | grep javaResults look similar to the following, where
6415is the pid:Bashcascade 6415 1.2 67.9 8546368 5203156 ? Sl Jun28 635:49 /usr/local/cascade/java/jre/bin/java ... -
Send a kill signal to that process:
Bashkill -3 6415
This kill signal does not stop the application. It writes a thread dump into tomcat/logs/catalina.out.
Windows, using PowerShell
- Open Task Manager.
-
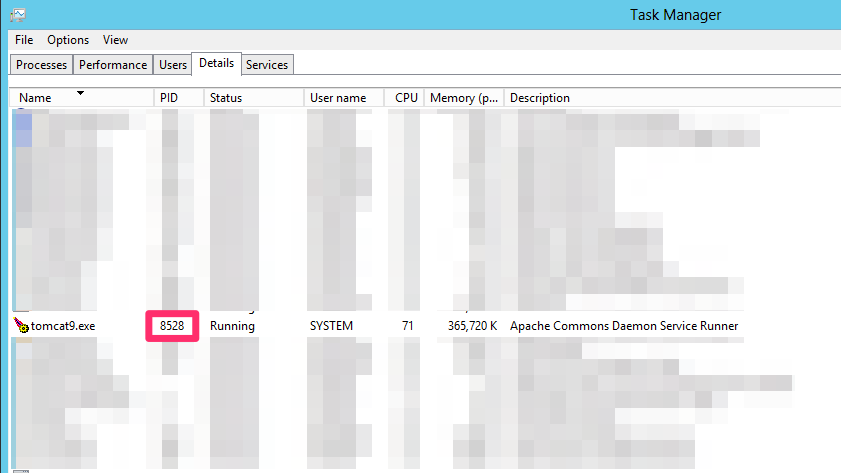
Locate the PID of the running Cascade CMS process — tomcat9.exe, for example:
- Open PowerShell using Run as Administrator.
-
Change into the java\bin folder, for example:
Bashcd 'C:\Program Files\Cascade CMS\java\jdk\bin' -
Run the following, replacing
<PID>with the pid you noted:Bash./jcmd <PID> Thread.print > cascade-thread-dump-dd-mm-yyyy.log
The thread dump is written to the file you named in that command.